Hi Just though I’d post my solution for the time sheets reports. I am quit happy with how it turned out. It could be modified for other qty reports too. I ended up staying with python. The [Intro to Python Blog Post] and a lot of time figuring out how how filters work for api calls later and I was able to do it.
# farmOS Time Sheet Report Code
# By: Zack Muma
# Date: 4/9/2023


# include packages
from farmOS import farmOS
from datetime import datetime, timezone
import csv
import pandas as pd


# assign login variables
hostname = ""
username = ""
password = ""

#create client
farm_client = farmOS(hostname)

# Authorize the client, save the token.
token = farm_client.authorize(username, password)


#convert date range to timestamp
startDate = datetime(2023,3,26,0) # start date input
endDate = datetime(2023,4,8,23,59,59) # end date input
startDatets = datetime.timestamp(startDate)
endDatets = datetime.timestamp(endDate)
#print(datetime.fromtimestamp(startDate))

#get name id's
Names = [","] #Put Names of users wanted for reports here.  Must be as shown in user asset
filters = farm_client.filter('name',Names, "IN")

#get all log hours between star and end date
for name_id in farm_client.resource.iterate('user', params=filters):
    csvRow = []
    filters = {
            **farm_client.filter('owner.id',name_id['id']),
            **farm_client.filter('timestamp',[(str(int(startDatets))),(str(int(endDatets)))],"BETWEEN"),
            }
    for response2 in farm_client.log.iterate('activity', params=filters):


        for qty_id in response2['relationships']['quantity']['data']:
            filterQty = {
                **farm_client.filter('id',qty_id['id']),
                **farm_client.filter('units.id','Unit ID here'), # put the id for the unit term wanted here
                }
            response3 = farm_client.resource.get('quantity', 'standard',params = filterQty)

            for value in response3['data']:
                logtime = datetime.fromisoformat(response2["attributes"]['timestamp'])
                csvRow.append((response2["attributes"]['name'], logtime.astimezone().strftime('%d/%m/%Y'), logtime.astimezone().strftime('%A'), value['attributes']['value']['decimal']))

    #create data frame for logs
    df = pd.DataFrame(csvRow, columns=["Log", "Date","Weekday", 'Hours'])
    df['Hours'] = df['Hours'].apply(pd.to_numeric)
    df['Date'] = pd.to_datetime(df['Date'],dayfirst = True)
    df.sort_values(['Date'],inplace = True)
    strHTML = df.to_html(index = False)

    #create HTML file
    path2 = f"" #put location for html file
    file = open(path2, 'w')

    #create header and imput first table into html file
    file.write(f"<h1>Timesheet for {name_id['attributes']['name']}</h1>")
    file.write(f"<h3>This pay period {startDate} to {endDate}</h3>")
    file.write(strHTML)

    #creating and writing second table to html file
    sumHours = df.groupby(['Date','Weekday'], as_index = False)['Hours'].sum()
    sumHours['Lunch Hours'] = 0
    sumHours.loc[sumHours['Hours'] > 5 ,'Lunch Hours'] = 0.5
    sumHours['Total'] = sumHours['Hours'] + sumHours['Lunch Hours']
    strHTML = sumHours.to_html(index = False)
    file.write(f"<h3>Hours by Day</h3>")
    file.write(strHTML)

    #addind up total hours and writing to html table
    totalHours = sumHours['Total'].sum()
    file.write(f"<h3>Total hours this pay period: {totalHours} hrs</h3>")
    file.close()
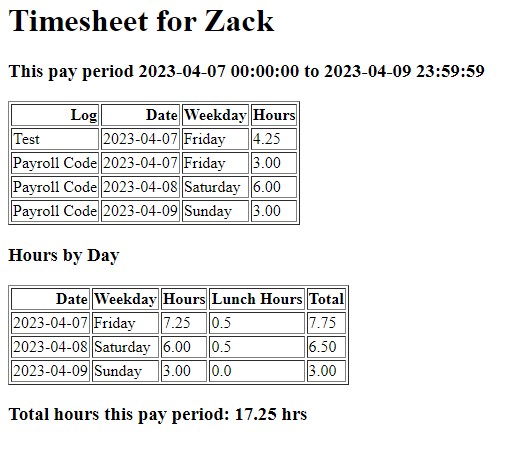
Here is what the output looks like. Its an HTML file.